Debugging Tools
This page goes into detail for debugging your WUI application.
Web client inspection tools
Since WUI is based on rendering inside a headless browser, we can seamlessly use common browser debugging tools.
A small video showing how you might change a word or title in your UI. This example also shows the auto live-reloading of the dev server.
Enabling inspection tools
The class WuoConfig in the docs has these properties for this purpose:
devtoolsMode(defaultDISABLED):DISABLED,ENABLEDremoteDebuggingPort(default8088):int
When re-compiling and starting your program you can do the following to access your page:
- start your program (with
devtoolsMode = ENABLEDand a valid port (make sure the port is not occupied!)). - Open any chrome-based web browser (e.g. chrome, vivaldi, opera, brave, etc.) enter
<browser>://inspect(e.g.vivaldi://inspect). - Check "Discover network targets"
- Click "Configure" next to the checkbox
- Enter "localhost:$PORT" as a new target (the port is the one set in
remoteDebuggingPort) - Click "Done"
- Your program should now show up as a normal page to debug on "Remote Targets" as long as your program is running.
The dev tools are very powerful, they show the current state of just your UI. Of course you can use the entire capabilities of your browsers dev tools (which are extensive) as well as getting networking insight into your UI. Here your UI truly is nothing more than a website running in a browser.
As long as your system is reachable over a network, you can freely debug from a different computer as well (adjusting localhost to a remote address).
The dev tools expose the globalThis DOM object in the console, making it possible to directly communicate with WUIs internal structure and your events or datasets including the internal browser data and its cookies or other storage information as well as WUI itself and its internal state.
As a consequence it is not recommended to enable dev tools on any production build or when delivering to the end-user. Doing so will expose your data to anyone with dev tools pointed at your program.
Sadly Firefoxs dev tools are not compatible with WUIs dev tools as they are based on chrome/Webkit 2.0 internally.
Event Replaying
Since version 0.1.9 in the core library, you can create .wlog files for each of your tabs docs.
.wlog files are csv files that contain all sendEvent calls the library has sent to this tab.
The events are logged relative to the start of the logfile and are not timestamped (in ms). The event name and json payload are included.
Previously navigating to your UI in a browser would crash the window since technically the WUI backend is missing. Since npm module version 2.3.0 you can navigate to your UI with your web browser of choice and if the replay tool is initialized, you can now replay a log file.
A short Video showing the replay tool in action on the bouncing objects project.
This functionality is a debugging tool and should be used as such.
The .wlog files could contain sensitive information about your application and its users. Make sure to handle them with care.
The log files can grow quite fast depending on your application, make sure to not log unnneccessarily when not debugging.
Enabling Event Replaying
The npm module holds a function from a named export replayTool. It has a single function that needs to be called to initialize the replay tool.
This must happen before anything else calls any other function/hook from the WUI npm library.
E.g.
// paste this at the very top of your index.js/ts/tsx file

import { initializeReplayTool } from '@wui/web-user-interface-lib/replayTool';
initializeReplayTool();
Afterwards the error of the missing backend and engine interface will be gone and you can navigate to your UI in your browser.
The following screenshot shows the replay tool in action using the bouncing objects project in C++.
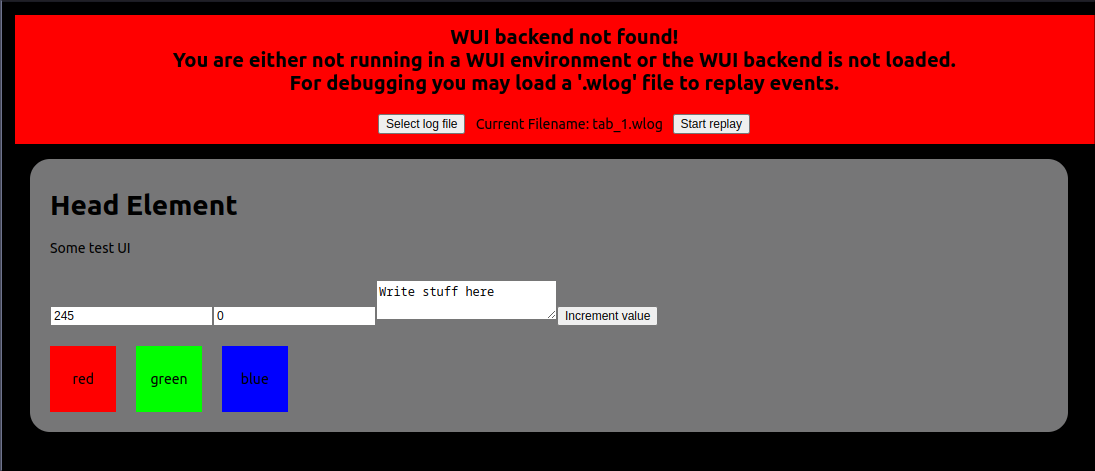
Step by step:
- Click "Select log file" and choose any
.wlogfile you want to replay. - Click "Start replay" to start the replay.
- At this point the page will reload and immediately start following the events in the log.
- The replay settings at the top are gone
- The bottom left will show (hovering) the current filename that is playing.
- Once the replay is done, the page will instanciate the settings at the top again
The controls of the replay are written into the window.localstorage interface of your browser. Should errornous replays or other problems crash the replay tool, you can manually reset the settings by clearing your local storage/ site cache.
To parse CSV files cleanly, the WUI library has an added peer dependency papa parse. This dependency has about 1.5MB of size, so if the replay tool is not required in your project make sure to not download it even as a peer dependency (it is marked optional).